The picture of the company is always a few weeks behind the decision.
The numbers exist — across statements, systems and spreadsheets. What takes the time is assembling them into something a board can read, and doing it again the following month.
The reporting cycle, without the assembly.
The reading, not only the figures
Vertical and horizontal analysis, ratios by category, working capital and cash conversion — the reading a senior professional would produce, computed as the data arrives.
Budget against actual, and what follows
Variance by line, scenarios modelled against the plan, and the cash position projected forward from the position as it stands today.
Board material on cycle
The monthly and quarterly reporting produced in native format, carrying your identity — so the time goes into examining the result rather than formatting it.
Loaded once, current every month.
Statements enter as they close. Ratios, variances, cash position and the reporting are computed from the same base, so the following period is an update rather than a rebuild.
Every figure traces back to the statement it came from, which is what allows a number to be defended when the board asks where it came from.
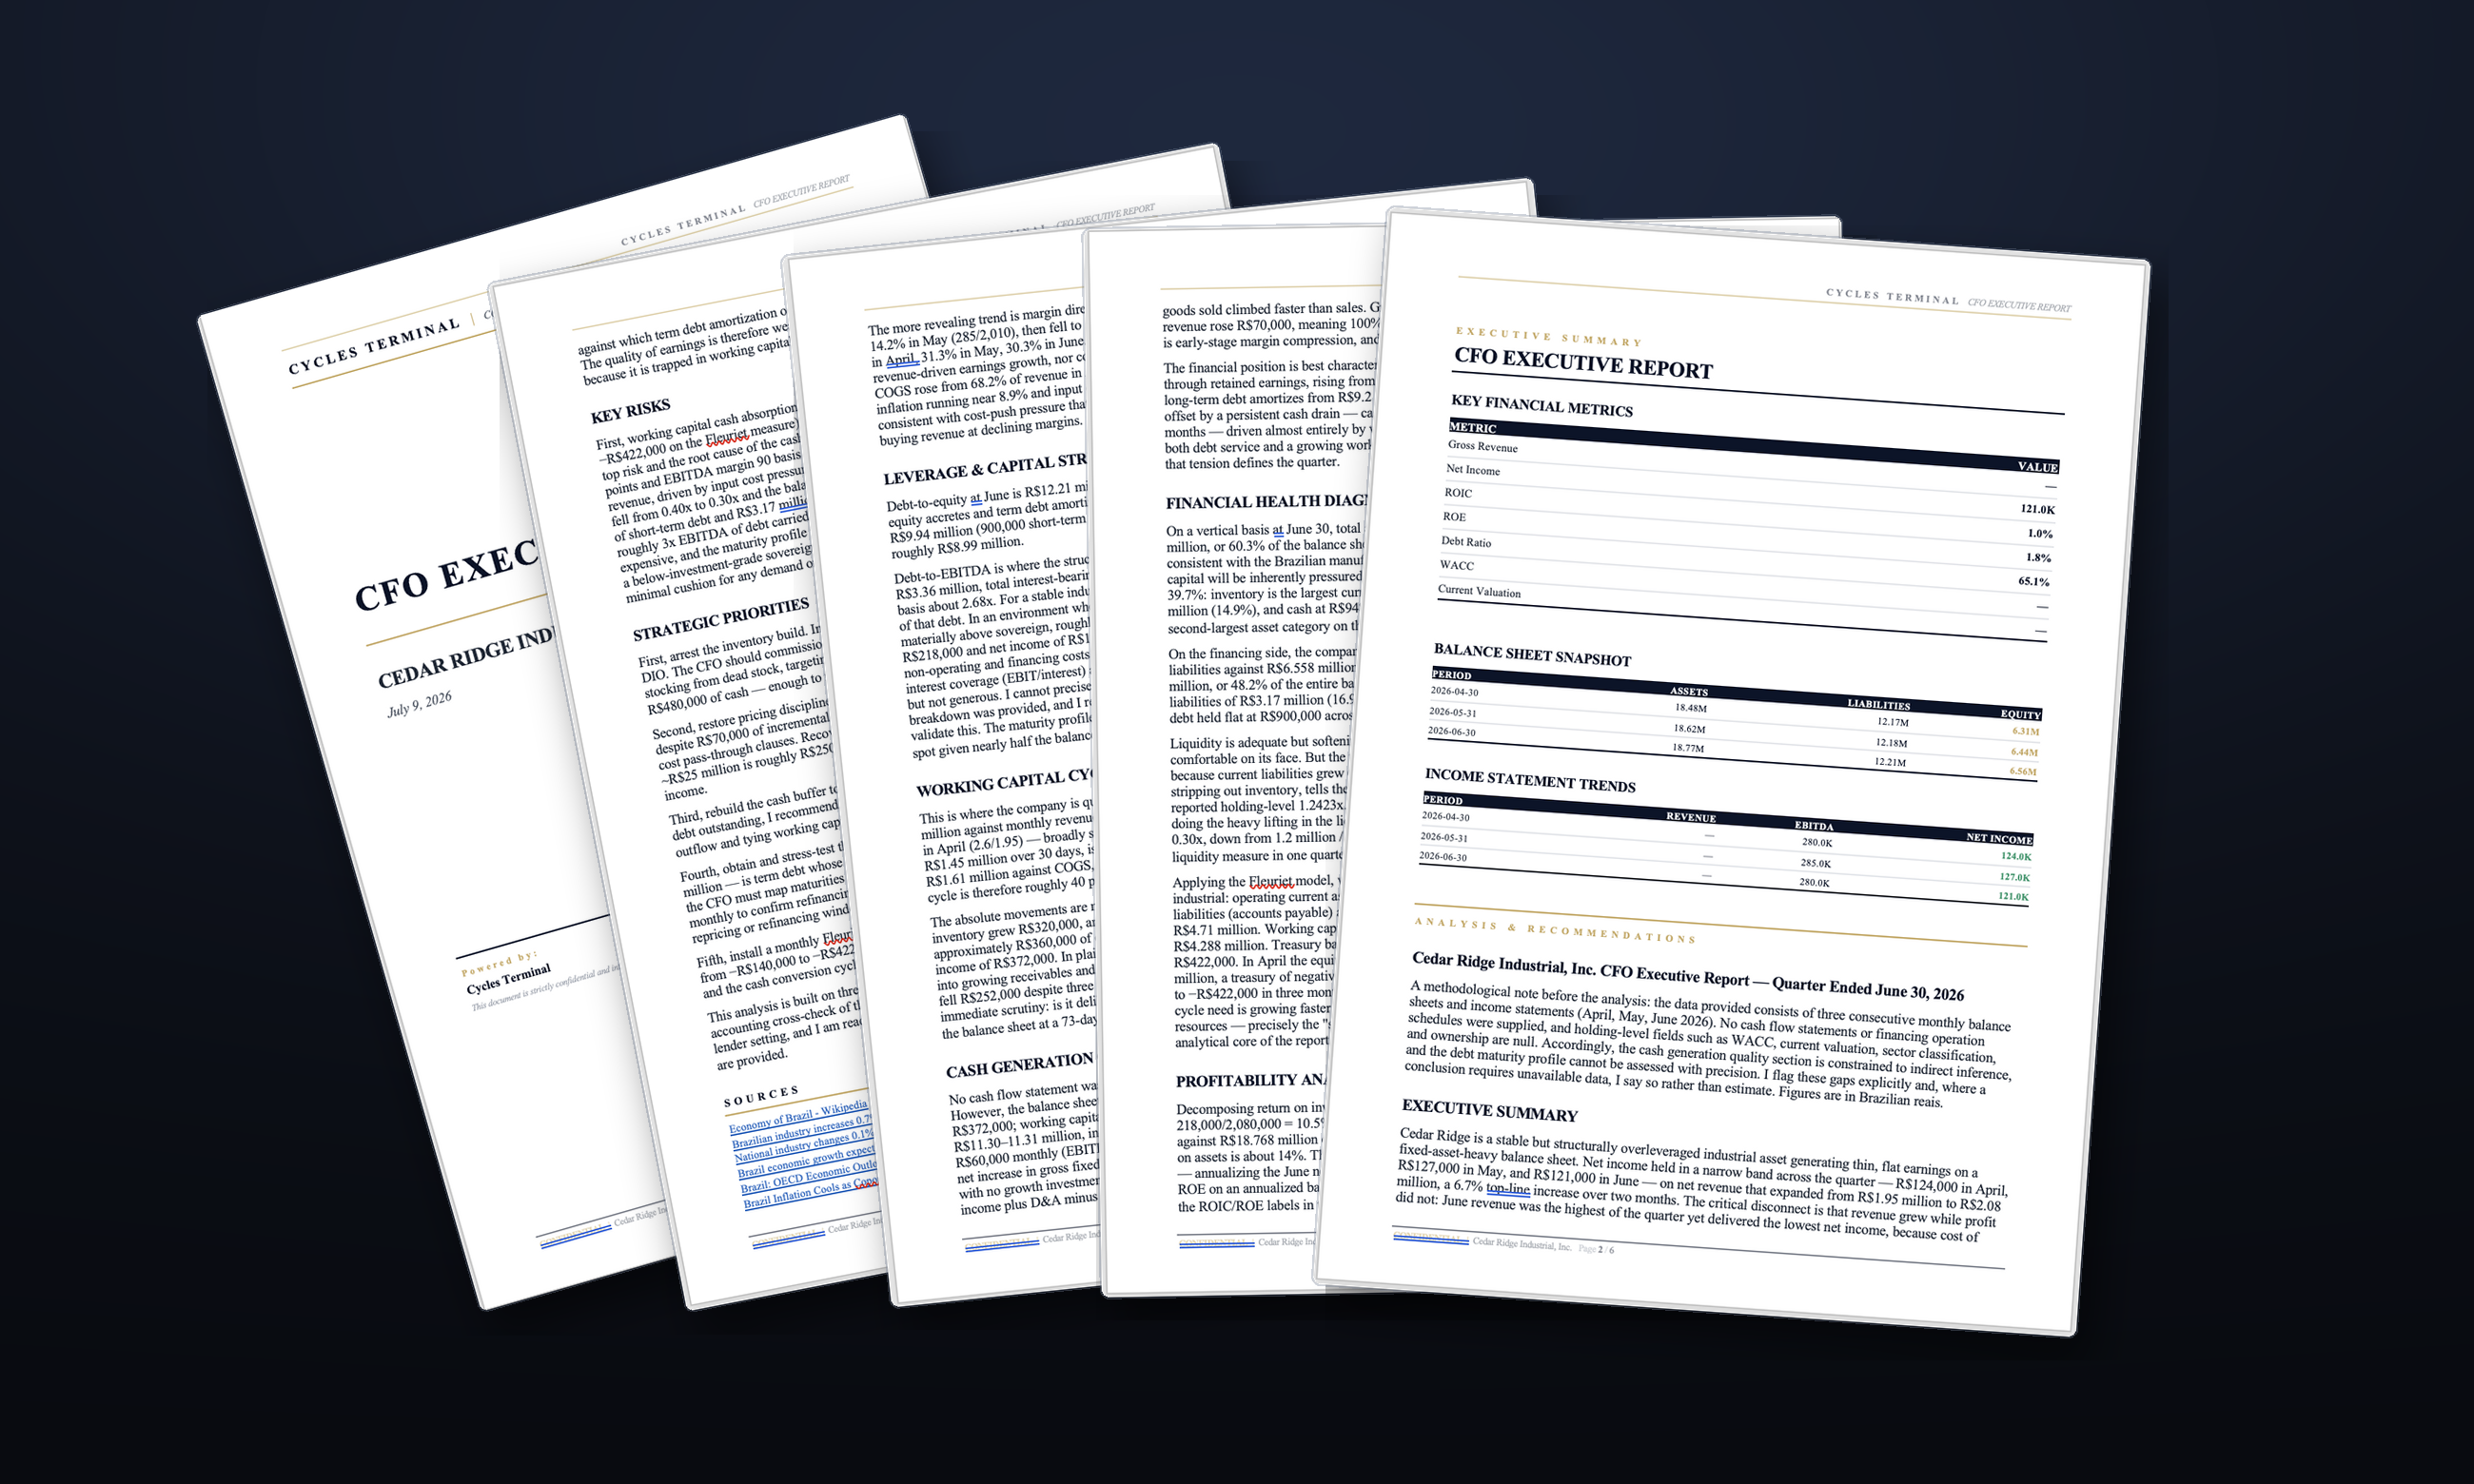
Produced in the formats the work requires.
See it on a real case.
In a demonstration we analyse a company, produce the deliverables, and show Ask Cycles working across them.